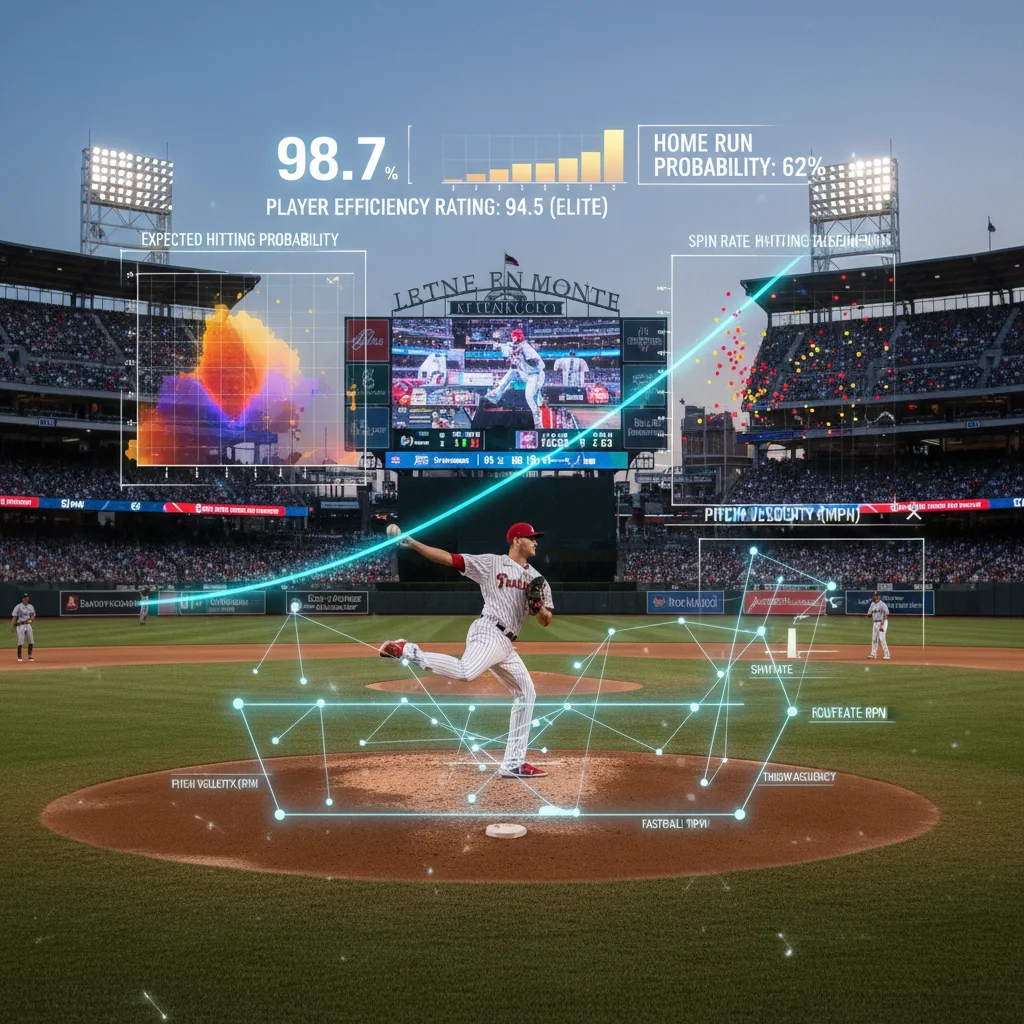
MLB Player Evaluation: Beyond the Box Score Metrics
This article delves into the seven key metrics revolutionizing MLB player evaluation, moving beyond traditional box scores. Discover how advanced analytics provide deeper insights into player performance and talent assessment in modern baseball.
By: Michael Sete on agosto 22, 2026
In the dynamic world of Major League Baseball (MLB), the way we assess player performance has dramatically evolved. Gone are the days when simple batting averages and ERA told the whole story. Today, a deeper understanding of talent comes from MLB player evaluation metrics that look far beyond the traditional box score. These advanced analytics provide intricate details, offering teams and fans alike a much clearer picture of a player’s true value and potential.
This shift represents a true revolution in how baseball is analyzed. Modern metrics move past surface-level statistics to uncover the underlying skills and contributions that often go unnoticed. By examining these sophisticated measures, we can gain unparalleled insights into hitting, pitching, and fielding, ultimately leading to more informed decisions in roster construction, player development, and game strategy. Let’s dive into some of the most impactful metrics that are reshaping MLB player evaluation.
WAR (Wins Above Replacement): The All-Encompassing Metric
WAR, or Wins Above Replacement, stands as one of the most comprehensive and widely cited advanced statistics in modern baseball. It attempts to quantify a player’s total contribution to their team in a single number, comparing them to a hypothetical “replacement-level” player who would be readily available from the minor leagues or free agency. A replacement-level player is considered to be one who would perform at a below-average level, essentially a player you could easily replace without much cost. Therefore, any positive WAR value indicates a player is contributing more than a readily available alternative, with higher numbers signifying greater impact.
Calculating WAR is a complex process, as it takes into account a player’s performance in all facets of the game: hitting, pitching, fielding, and even base running. Different versions of WAR exist, primarily from Baseball-Reference (bWAR) and FanGraphs (fWAR), each with slightly different methodologies for weighting these contributions. For example, fWAR places a greater emphasis on FIP (Fielding Independent Pitching) for pitchers, while bWAR uses ERA. Despite these minor differences, both versions aim to provide a holistic view of a player’s value, making it an indispensable tool for MLB player evaluation metrics.
WAR helps teams identify undervalued players, understand the true impact of their stars, and make more strategic decisions during trades and free agency. It allows for cross-positional comparisons, meaning you can compare the value of a star pitcher to a star shortstop, which was nearly impossible with traditional statistics. While not perfect, WAR offers a powerful framework for understanding player contributions in a way that traditional stats simply cannot. It has become a cornerstone of analytical discussions, providing a common language for evaluating overall player worth.
Exit Velocity and Launch Angle: Redefining Hitting Success
In the past, a hit was a hit, and the focus was primarily on batting average and slugging percentage. Today, thanks to advanced tracking technologies like Statcast, we can delve much deeper into the quality of contact a batter makes. Exit velocity, measured in miles per hour, indicates how hard a ball is hit off the bat. A higher exit velocity generally correlates with a higher probability of a hit, and more importantly, a higher probability of extra-base hits. It tells us not just that a player hit the ball, but how well they hit it.
Launch angle, measured in degrees, describes the vertical angle at which the ball leaves the bat. This metric has revolutionized hitting approaches, as teams and players now understand the optimal launch angles for maximizing offensive production. Balls hit with a very low launch angle often result in ground balls, which are less likely to be hits and rarely lead to extra-base hits. Conversely, balls hit with a very high launch angle often result in pop-ups, which are almost always outs. The sweet spot for launch angle typically falls within a range that produces line drives and fly balls, which have the highest expected batting average and slugging percentage.
Together, exit velocity and launch angle paint a detailed picture of a hitter’s ability to make productive contact. Players who consistently achieve high exit velocities at optimal launch angles are highly valued. This combination helps explain why some players with seemingly lower batting averages might still be incredibly valuable offensive contributors – they might be hitting fewer balls, but when they do, they hit them exceptionally hard and at ideal angles. Understanding these metrics has led to significant adjustments in player development and coaching, emphasizing quality of contact over simply putting the ball in play.
K/BB Ratio and FIP: Unpacking Pitching Dominance
Traditional pitching statistics like ERA (Earned Run Average) are still important, but they can be heavily influenced by factors outside a pitcher’s control, such as defensive performance and luck. To get a more accurate read on a pitcher’s true skill, modern MLB player evaluation metrics rely on statistics that isolate a pitcher’s individual contributions. The K/BB ratio, or Strikeout-to-Walk Ratio, is a prime example. This simple yet powerful metric measures how many batters a pitcher strikes out for every one they walk. A high K/BB ratio indicates a pitcher’s ability to dominate hitters by missing bats and limiting free passes, both of which are direct outcomes of their own performance.
Another crucial metric is FIP (Fielding Independent Pitching). FIP attempts to measure a pitcher’s effectiveness based solely on the events they can control: strikeouts, walks, hit-by-pitches, and home runs. It essentially removes the influence of defense and luck on balls put in play, providing a clearer picture of a pitcher’s underlying skill. The theory behind FIP is that while a pitcher can influence whether a ball is put in play, they have less control over where it lands or how well their fielders play it. Therefore, FIP calculates what a pitcher’s ERA *should have been* if they had experienced league-average results on balls in play.
Why These Metrics Matter
Predictive Power: Both K/BB ratio and FIP are considered more predictive of future pitching success than ERA.
Isolates Skill: They strip away external factors, allowing for a pure assessment of a pitcher’s talent.
Identifies Value: Teams use these to identify pitchers who might be undervalued by traditional stats due to poor defensive support or bad luck.
Development Tool: Coaches use these metrics to track and improve a pitcher’s ability to miss bats and control the strike zone.
By focusing on K/BB and FIP, teams can better evaluate pitching talent, make more informed decisions about acquisitions, and develop their pitchers more effectively. These metrics highlight the core abilities that lead to sustained success on the mound, offering a more stable and reliable measure of a pitcher’s true worth than ERA alone.
Statcast Fielding Metrics: Beyond the Error Column
Fielding has long been one of the hardest aspects of baseball to quantify accurately. Traditional statistics like fielding percentage only tell part of the story, focusing on errors made rather than plays made or prevented. With the advent of Statcast data, MLB player evaluation metrics for defense have become incredibly sophisticated, offering a granular look at a fielder’s range, arm strength, and overall impact. These metrics move far beyond the simple error column, recognizing that a player who consistently gets to more balls and makes difficult plays is far more valuable than one who simply avoids errors on routine chances.
One of the most prominent Statcast fielding metrics is Outs Above Average (OAA). OAA measures how many outs a player saves or costs their team relative to an average fielder. It takes into account the difficulty of each play, factoring in the distance a fielder has to travel, the time they have to get there, and the direction of the ball. A player with a high OAA consistently makes plays that the average fielder would not, effectively turning potential hits into outs. This metric is particularly powerful because it can be applied to both infielders and outfielders, providing a universal measure of defensive prowess.
Another valuable metric, especially for outfielders, is Catch Probability. This metric assigns a probability to every fly ball or line drive hit into the outfield, indicating the likelihood of an average outfielder making the catch. When a player makes a catch with a low catch probability, it highlights their exceptional range and skill. Similarly, for infielders, metrics like Arm Strength and Sprint Speed contribute to a more complete defensive profile. These advanced fielding metrics allow teams to identify elite defenders, understand defensive synergies, and build a more robust and efficient defense, ultimately saving runs and contributing significantly to team success.
WOBA and xwOBA: The Next Generation of Offensive Value
While batting average and on-base percentage remain familiar, modern MLB player evaluation metrics have introduced more sophisticated ways to measure a hitter’s true offensive contribution. Weighted On-Base Average (wOBA) is a prime example, offering a more accurate representation of offensive value than traditional stats. Unlike batting average, which treats all hits equally, wOBA assigns different weights to different types of offensive events based on their actual run value. For instance, a double is worth more than a single, and a home run is worth significantly more than any other hit. Walks are also included and weighted appropriately, reflecting their importance in creating scoring opportunities.
wOBA provides a single number that reflects a player’s overall offensive production, making it much easier to compare players across different positions and eras. It gives credit where credit is due, recognizing that a player who hits a lot of doubles and home runs, even with a slightly lower batting average, might be more valuable than a player who gets many singles. This metric helps teams identify truly productive hitters and understand how efficiently they are creating runs for their team. It’s a significant upgrade over traditional slugging percentage, as it also accounts for the value of walks, which slugging percentage ignores.
Building on wOBA’s foundation, Expected Weighted On-Base Average (xwOBA) takes offensive evaluation a step further by removing the element of luck. Using Statcast data like exit velocity and launch angle, xwOBA estimates what a player’s wOBA *should have been* based on the quality of their contact. This means that if a player hits a lot of hard-hit balls at optimal launch angles but has bad luck with them finding fielders, their xwOBA will be higher than their actual wOBA. Conversely, a player who gets lucky with soft contact finding gaps will have a lower xwOBA than their wOBA.
Key Benefits of xwOBA
Luck Neutral: Provides a truer measure of a hitter’s skill by removing batted-ball luck.
Predictive: Often a better predictor of future offensive performance than actual wOBA.
Talent Identification: Helps identify players who are underperforming or overperforming relative to their true talent level.
Player Development: Coaches can use it to assess if a player’s hitting approach is leading to quality contact, even if results aren’t immediately visible.
By utilizing wOBA and xwOBA, teams gain a powerful pair of tools for dissecting offensive performance, making more informed decisions about player acquisition, and optimizing player development strategies. These metrics represent the cutting edge of offensive MLB player evaluation metrics, offering a far more nuanced and predictive understanding of a hitter’s value than anything available in the past.
Frequently Asked Questions
What is the main purpose of advanced MLB player evaluation metrics?
The primary purpose of advanced MLB player evaluation metrics is to provide a more accurate and comprehensive understanding of a player’s true value and contribution to their team, moving beyond the limitations of traditional box score statistics. They aim to isolate a player’s skill and predict future performance more reliably.
How do WAR and FIP differ from traditional stats like batting average and ERA?
WAR and FIP differ significantly by attempting to quantify a player’s overall impact (WAR) or isolate a pitcher’s skill independent of defense (FIP). Traditional stats often blend a player’s performance with external factors, whereas advanced metrics aim to strip away luck and defensive influence to measure inherent talent.
Why are exit velocity and launch angle important for hitters?
Exit velocity and launch angle are crucial because they directly measure the quality of contact a hitter makes. They reveal how hard a ball is hit and at what angle, which are strong indicators of a higher probability for hits, extra-base hits, and overall offensive production, offering insights beyond just whether a ball was hit.
Can these advanced metrics be used for all positions?
Yes, advanced metrics are developed to evaluate players across all positions. While some metrics are position-specific (like certain fielding stats), others like WAR, wOBA, and xwOBA are designed to provide a holistic or comparable evaluation of offensive and defensive contributions regardless of a player’s role on the field.
Are advanced analytics replacing traditional baseball scouting?
No, advanced analytics are not replacing traditional baseball scouting but rather complementing it. Scouts provide invaluable qualitative insights into a player’s makeup, work ethic, and intangibles that metrics cannot capture. The most successful teams integrate both analytical data and traditional scouting to make the most informed decisions.
The landscape of MLB player evaluation has undergone a profound transformation, moving light-years beyond the limited scope of traditional box scores. The seven key metrics we’ve explored—WAR, Exit Velocity, Launch Angle, K/BB Ratio, FIP, Statcast Fielding Metrics, wOBA, and xwOBA—are not just numbers; they are sophisticated lenses through which we can truly understand and appreciate the multifaceted contributions of every player. These advanced analytics provide an unparalleled depth of insight, allowing teams to make smarter decisions in player acquisition, development, and game strategy, while offering fans a richer, more nuanced way to engage with the sport.
By embracing these cutting-edge tools, baseball continues to evolve, pushing the boundaries of what’s possible in understanding athletic performance. The synergy between statistical analysis and traditional scouting creates a powerful framework for identifying talent and building championship-caliber teams. As technology advances, we can expect even more innovative metrics to emerge, further refining our ability to evaluate and celebrate the incredible athletes who play America’s pastime. The future of baseball analysis is bright, promising an even deeper appreciation for the game’s intricate beauty.