Discover the profound impact of new catcher framing metrics on how we assess pitcher performance. These advanced stats offer deeper insights into a catcher's ability to turn borderline pitches into strikes, fundamentally reshaping traditional baseball analytics and player valuation.
By: pedropadm2025@gmail.com on agosto 22, 2026
Baseball, at its core, is a game of nuanced interactions, and few are as critical as the one between a pitcher and a catcher. For decades, evaluating pitcher performance largely focused on traditional statistics like ERA, strikeouts, and walks. However, the rise of advanced analytics has brought new clarity to the subtle art of the game, especially concerning catcher framing metrics. These innovative statistics are fundamentally changing how we understand and value the contributions of both pitchers and their battery mates.
The impact of a catcher’s ability to ‘frame’ a pitch – making a borderline ball look like a strike to the umpire – is now quantifiable. These new metrics provide an objective lens through which to assess a skill that was once considered subjective and immeasurable. By delving into these advanced stats, we can gain a much richer understanding of how catchers directly influence game outcomes and, crucially, how they elevate the performance of their pitchers. This shift in evaluation is not just academic; it has real-world implications for player contracts, team strategies, and even Hall of Fame discussions.
Understanding the Core of Catcher Framing Metrics
Catcher framing metrics represent a significant leap forward in baseball analytics. Traditionally, a catcher’s value was often tied to their defensive prowess in blocking pitches, throwing out runners, and calling games. While these skills remain vital, the ability to steal strikes for a pitcher was largely an anecdotal observation, attributed to certain catchers but rarely quantified with precision. Modern technology, particularly advanced tracking systems like Statcast, changed all that. These systems can meticulously track the exact location of every pitch as it crosses home plate, as well as the umpire’s subsequent call.
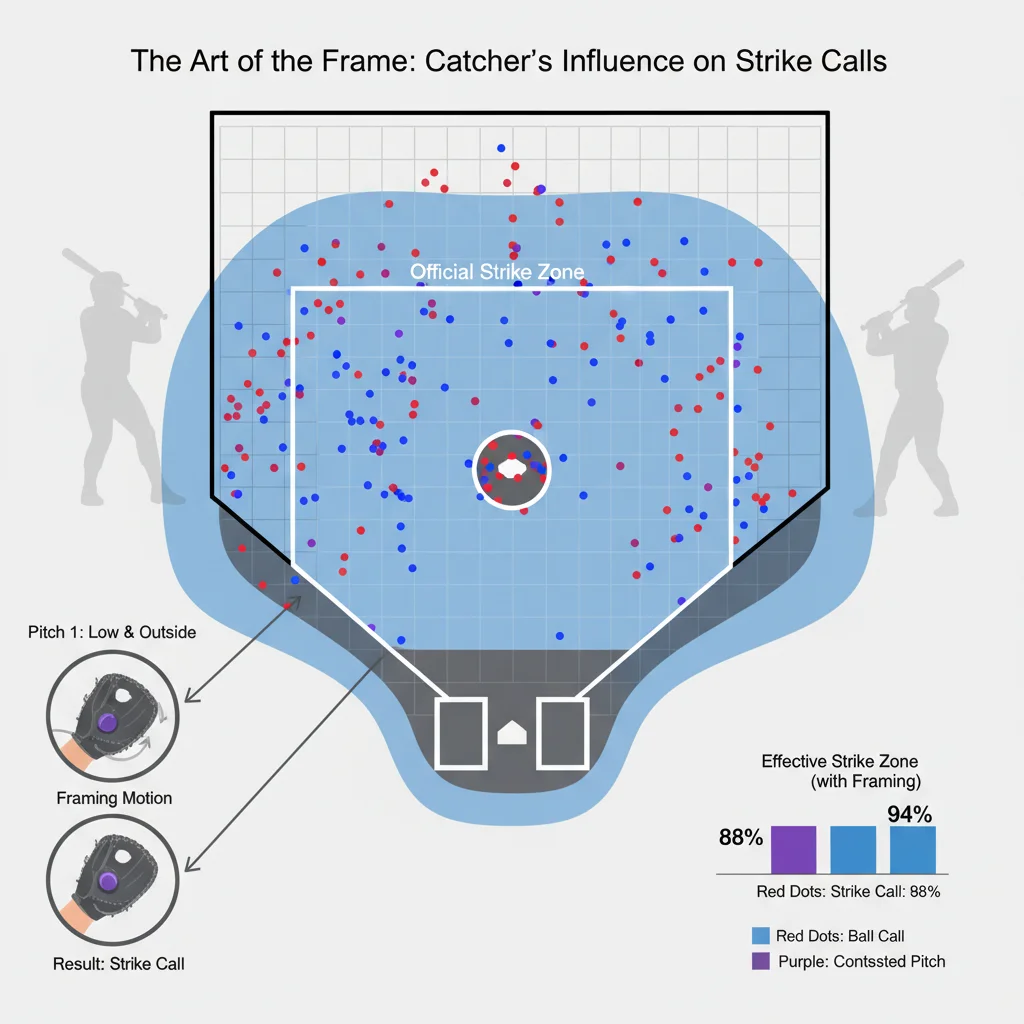
By comparing the actual pitch location to the umpire’s call, analysts can determine how often a catcher successfully converts a pitch outside the official strike zone into a called strike. This conversion rate is the bedrock of catcher framing metrics. It moves beyond simply noting if a pitch was a ball or a strike and instead asks: ‘Did the catcher’s actions influence that call?’ This granular data allows for a much more accurate assessment of a catcher’s impact on the game, directly linking their receiving skills to tangible benefits for their pitching staff. Without this technology, such an analysis would be impossible, leaving a crucial aspect of the game unmeasured.
The evolution of these metrics didn’t happen overnight. Early attempts at quantifying framing were often rudimentary, relying on subjective video reviews or less precise data. However, as pitch tracking technology became more sophisticated and widespread, the data available to analysts grew exponentially. This allowed for the development of more robust and reliable models that account for various factors, such as the handedness of the batter, the velocity of the pitch, and even the individual tendencies of umpires. The goal is always to isolate the catcher’s influence as much as possible, filtering out other variables to get a clear picture of their framing ability. This continuous refinement ensures that the metrics are as accurate and fair as possible, providing valuable insights into a previously hidden skill.
The First Advanced Stat: Strike Rate Above Average
One of the foundational advanced statistics in the realm of catcher framing metrics is ‘Strike Rate Above Average’ (SRAA). This metric quantifies how many additional strikes a catcher gains for their pitchers compared to the league average. It’s a powerful tool because it moves beyond raw numbers and contextualizes a catcher’s performance against their peers. Instead of just knowing a catcher framed 50 pitches into strikes, SRAA tells us if that number is exceptional, average, or subpar, given the opportunities they had.
To calculate SRAA, analysts first determine the expected strike rate for every pitch based on its location, velocity, and other factors, assuming an average catcher. Then, they compare the actual strike rate achieved by a specific catcher to this expected rate. The difference, expressed as a positive or negative number, represents the catcher’s SRAA. A catcher with a high positive SRAA is effectively stealing strikes, turning borderline pitches into outs or favorable counts for their pitcher. This directly translates into fewer pitches thrown, lower pitch counts, and potentially deeper outings for the pitching staff, all of which are incredibly valuable in a long baseball season.
Impact on Pitcher Performance
Lower Pitch Counts: By turning balls into strikes, catchers reduce the number of pitches a pitcher needs to throw to get through an inning, preserving arm strength.
Favorable Counts: More strikes mean pitchers work from ahead in the count more often, allowing them to be more aggressive and effective with their pitch selection.
Increased Strikeouts: Working from ahead often leads to more swings and misses, increasing strikeout opportunities.
Improved ERA: Fewer walks and more efficient innings naturally contribute to a lower earned run average for pitchers.
The beauty of SRAA is its simplicity in conveying a complex skill. A catcher who consistently adds strikes above average is a significant asset, directly contributing to the success of their pitching staff. This metric helps teams identify catchers who excel in this subtle but critical aspect of the game, providing a clear, data-driven reason to value their defensive contributions beyond traditional fielding statistics.
The Second Advanced Stat: Runs Saved from Framing
While ‘Strike Rate Above Average’ tells us how many extra strikes a catcher gains, ‘Runs Saved from Framing’ (RSF) takes that impact a step further by translating those strikes directly into a tangible measure of value: runs. This metric is incredibly powerful because it quantifies the financial and competitive worth of a catcher’s framing ability in a language that every team understands – runs. In baseball, preventing runs is just as important as scoring them, and RSF highlights a catcher’s direct contribution to run prevention through their receiving skills.
The calculation of RSF involves assigning a run value to each framed strike. This run value is derived from extensive historical data that shows how often an additional strike in a particular game situation (e.g., 0-1 count vs. 1-0 count, bases empty vs. runners on) leads to a reduction in expected runs scored by the opposing team. For instance, turning a 1-0 count into an 0-2 count significantly increases the pitcher’s chances of getting an out and reduces the likelihood of the batter reaching base, thereby saving potential runs. By aggregating these individual run values across all the pitches a catcher frames, we arrive at their total Runs Saved from Framing.
A catcher with a high positive RSF is essentially adding defensive value to their team’s run differential, much like a great hitter adds offensive value. This metric allows front offices to understand the direct impact of a catcher’s framing on the team’s bottom line. It’s no longer just about ‘good hands’ or ‘a good eye’; it’s about quantifiable run prevention. Teams can use RSF to justify investments in catchers who might not be offensive powerhouses but provide immense value through their defensive contributions, particularly their ability to steal strikes. This holistic view of a player’s worth is essential for building competitive rosters in modern baseball.
How Catcher Framing Metrics Redefine Pitcher Performance
The advent of sophisticated catcher framing metrics has fundamentally altered how we evaluate pitcher performance. Before these stats became prevalent, a pitcher’s effectiveness was often viewed in a vacuum, or at least with less consideration for the catcher’s role. A pitcher’s low ERA or high strikeout total was attributed almost solely to their own talent and execution. However, we now understand that a significant portion of a pitcher’s success can be directly influenced, and even enhanced, by an elite pitch-framing catcher. This realization prompts a re-evaluation of historical pitcher statistics and a more nuanced approach to current player assessment.
Consider a pitcher who consistently works with a catcher known for their exceptional framing. That pitcher might benefit from an extra 10-20 called strikes per start over the course of a season, simply because their catcher is adept at making borderline pitches look like strikes. These extra strikes can mean the difference between a 3-2 count and an 0-2 count, or between a walk and a strikeout. Such differences dramatically impact a pitcher’s efficiency, pitch count, and ultimately, their earned run average (ERA) and WHIP (Walks plus Hits per Inning Pitched). A pitcher’s seemingly stellar numbers might, in part, be a testament to their catcher’s hidden talent.
Moreover, these metrics highlight the symbiotic relationship between a pitcher and catcher. A pitcher who trusts their catcher’s framing ability might be more willing to challenge hitters on the edges of the strike zone, knowing that even a slightly off-target pitch could still be called a strike. This confidence can lead to more aggressive and effective pitching, reducing the number of hittable pitches thrown over the heart of the plate. Consequently, when evaluating a pitcher, it’s now crucial to consider who is behind the plate. A pitcher’s performance might fluctuate not just due to their own form, but also due to the framing skills of their catching partner. This deeper understanding enriches our appreciation for the battery as a unit, rather than just two individual players.
Strategic Implications for Teams and Player Valuation
The integration of advanced catcher framing metrics into baseball analytics has profound strategic implications for teams and significantly impacts player valuation. In an increasingly competitive landscape, every edge counts, and the ability to accurately assess a player’s true worth is paramount. Teams are no longer solely focused on a catcher’s offensive output or traditional defensive stats; their framing ability is now a critical component in roster construction and contract negotiations. This shift represents a maturation of baseball’s analytical approach, recognizing and rewarding previously unquantified skills.
For front offices, understanding a catcher’s framing prowess allows for more informed decision-making. A catcher who might appear average offensively but consistently saves a significant number of runs through framing becomes a much more valuable asset. This could mean signing a catcher with elite framing skills to a larger contract, even if their batting average is modest, because their overall contribution to winning is demonstrably high. Conversely, a catcher with strong offensive numbers but poor framing might see their overall value diminish when these metrics are considered, as their offensive gains could be offset by their defensive liabilities in terms of pitch calls.
Furthermore, these metrics influence game strategy. Managers might prioritize catchers with superior framing skills for certain pitchers or in critical game situations where every borderline call matters. Pitching coaches can also use this data to help pitchers understand where their catcher excels at framing, encouraging them to target those specific areas of the strike zone. This synergy can optimize pitch sequencing and enhance the overall effectiveness of the pitching staff. The strategic implications extend to player development as well; minor league catchers can now be specifically coached and evaluated on their framing techniques, grooming the next generation of elite receivers based on objective data, not just subjective observation. This data-driven approach ensures that talent identification and development are aligned with the most impactful aspects of the game.
Challenges and Future of Catcher Framing Analytics
Despite their undeniable value, catcher framing metrics are not without their challenges and areas for future development. One primary challenge lies in the inherent variability of umpire performance. While framing metrics attempt to isolate the catcher’s influence, the human element of umpiring introduces a degree of unpredictability. Different umpires have different strike zones, and their consistency can vary from game to game, or even pitch to pitch. Developing models that can further account for and normalize these umpire tendencies remains an ongoing area of research. The goal is to ensure that a catcher’s framing score truly reflects their skill, rather than simply how often they happen to catch for a generous umpire.
Another area of focus is the interaction between framing and other defensive skills. A catcher might be an elite framer but struggle with blocking pitches or throwing out runners. Integrating these various defensive contributions into a single, comprehensive defensive value metric is complex but crucial for a holistic player evaluation. Future analytics will likely aim to create more sophisticated models that weigh and combine these different defensive facets, providing a single, all-encompassing defensive score for catchers. This would offer an even clearer picture of a catcher’s overall impact behind the plate, moving beyond individual skills to a combined defensive output.
The future of catcher framing analytics also involves exploring new technologies and data sources. Advances in biomechanics and motion capture could provide even more granular insights into the subtle movements catchers make to influence calls. Understanding which specific glove movements, body positions, and timing cues are most effective could lead to even more precise coaching techniques and player development strategies. As the game continues to evolve and technology advances, so too will the sophistication of these metrics. The goal remains to uncover every hidden aspect of player value, making baseball analysis ever more insightful and accurate, ensuring that the true contributions of players like catchers are fully recognized and appreciated.
Frequently Asked Questions
What exactly is pitch framing?
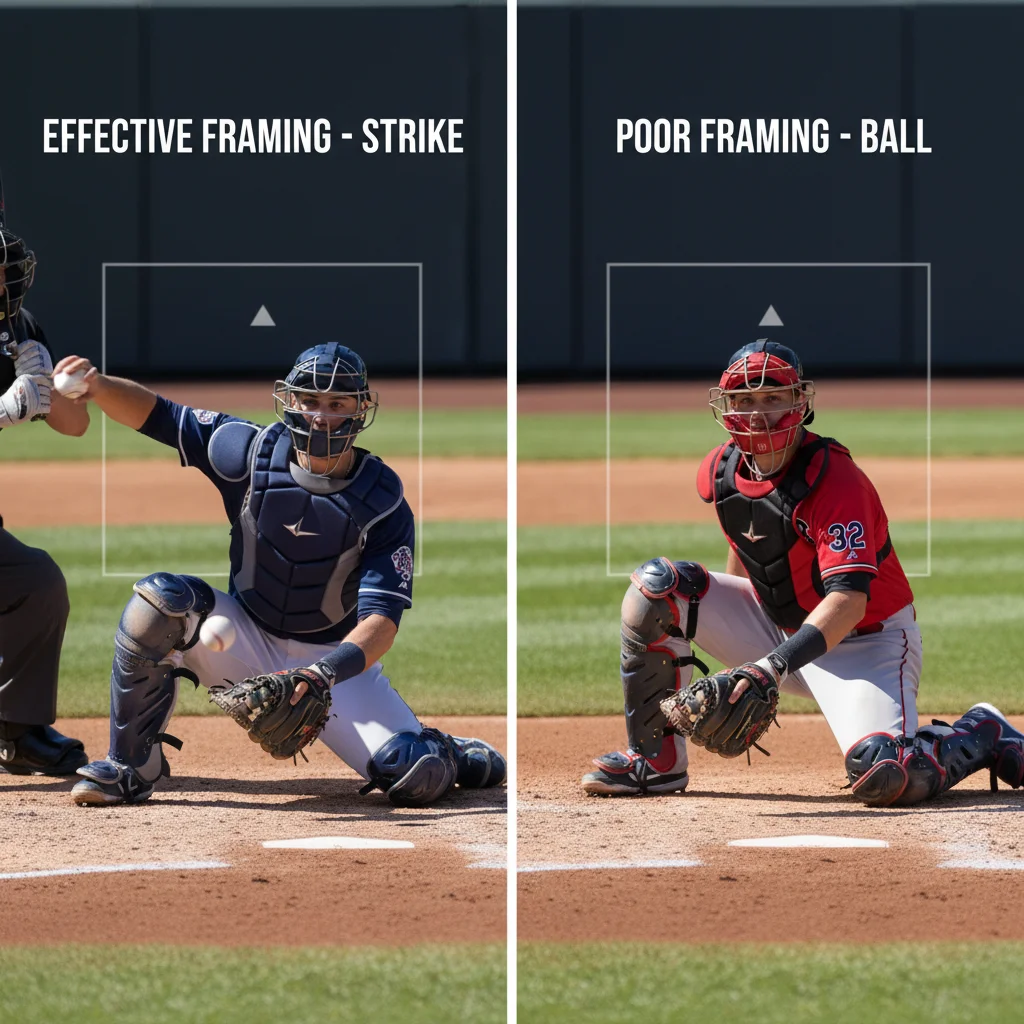
Pitch framing is the subtle art of a baseball catcher receiving a borderline pitch in a way that makes it appear to an umpire as a strike, even if its actual location is slightly outside the official strike zone. This technique can turn balls into strikes, benefitting the pitcher.
How do catcher framing metrics benefit pitchers?
Catcher framing metrics show that good framers help pitchers achieve lower pitch counts, work from more favorable counts (e.g., 0-1 instead of 1-0), increase their strikeout rates, and ultimately contribute to a lower earned run average (ERA) and WHIP.
Are these metrics used by professional baseball teams?
Yes, advanced catcher framing metrics are widely used by professional baseball teams, including front offices for player evaluation and contract negotiations, and by coaching staffs for game strategy and player development. They are now an integral part of modern baseball analytics.
Do catcher framing metrics account for umpire variability?
While framing metrics aim to isolate the catcher’s skill, umpire variability is a known factor. Analysts continually work to refine models to account for different umpire tendencies, ensuring the metrics primarily reflect the catcher’s influence rather than just favorable umpiring.
What is the difference between Strike Rate Above Average and Runs Saved from Framing?
Strike Rate Above Average (SRAA) quantifies the number of additional strikes a catcher gains compared to the league average. Runs Saved from Framing (RSF) translates those additional strikes into an estimated number of runs prevented, providing a more direct measure of a catcher’s value in terms of run prevention.
The evolution of baseball analytics has brought forth a new era of understanding player performance, with catcher framing metrics standing out as a prime example. These advanced statistics, such as Strike Rate Above Average and Runs Saved from Framing, have moved the assessment of a catcher’s subtle art from subjective observation to quantifiable impact. No longer can we discuss pitcher performance without acknowledging the profound influence of the catcher behind the plate. These metrics have not only redefined how we evaluate individual players but have also reshaped team strategies, player development programs, and even the economics of player contracts.
By providing a clear, data-driven lens into a previously hidden skill, catcher framing metrics offer invaluable insights for fans, analysts, and professional organizations alike. They highlight the symbiotic relationship between pitcher and catcher, revealing how a skilled receiver can significantly enhance a pitcher’s effectiveness and contribute directly to run prevention. As baseball continues to embrace data-driven decision-making, the importance of these metrics will only grow, ensuring that the true, comprehensive value of every player is recognized. Embrace these new insights to deepen your appreciation for the intricate dance between pitcher and catcher, and the subtle brilliance that helps shape the outcome of every game.
Peter B holds a degree in Journalism and has 5 years of experience covering U.S. economic policy, labor markets, and financial news. He writes data-driven news content on topics like inflation, interest rates, and employment trends.