Advanced scouting reports are revolutionizing baseball by pinpointing hitter weaknesses. Learn how four critical data points empower teams to predict performance and gain a significant competitive advantage on the field.
By: pedropadm2025@gmail.com on agosto 22, 2026
In the competitive world of baseball, understanding hitter weaknesses scouting is paramount for success. Teams are constantly seeking an edge, and advanced scouting reports provide exactly that. These detailed analyses go far beyond traditional observations, diving deep into data to uncover patterns and tendencies that can predict a hitter’s struggles with remarkable accuracy. By focusing on specific metrics, coaches and pitchers can formulate strategies to exploit vulnerabilities, significantly increasing their chances of success on the mound.
The ability to anticipate a hitter’s response to certain pitches or situations is a game-changer. Modern baseball relies heavily on data-driven decisions, transforming how teams prepare for opponents. This article will explore the four key data points that have proven most effective in revealing hitter weaknesses, offering a comprehensive look at how these insights are gathered and applied to gain a significant competitive advantage.
Understanding Pitch Tracking Data and Zone Control
Pitch tracking data has become an indispensable tool for identifying hitter weaknesses. This technology records every pitch’s speed, spin rate, movement, and precise location within the strike zone. By analyzing a hitter’s performance against different pitch types in various zones, scouts can pinpoint areas where a batter consistently struggles. For instance, a hitter might excel against fastballs down the middle but frequently strike out on breaking balls low and away. This detailed breakdown allows pitchers to attack those specific weak spots with confidence, knowing they have a higher probability of inducing a weak contact or a strikeout.
Moreover, pitch tracking data helps identify a hitter’s plate discipline. Some batters are prone to chasing pitches outside the strike zone, especially in certain counts. If a hitter consistently swings at sliders in the dirt when behind in the count, that becomes a clear vulnerability for opposing pitchers to exploit. Understanding a hitter’s zone control, or lack thereof, is crucial. It’s not just about what pitches they miss, but also about what pitches they swing at and make poor contact with, or don’t swing at when they should.
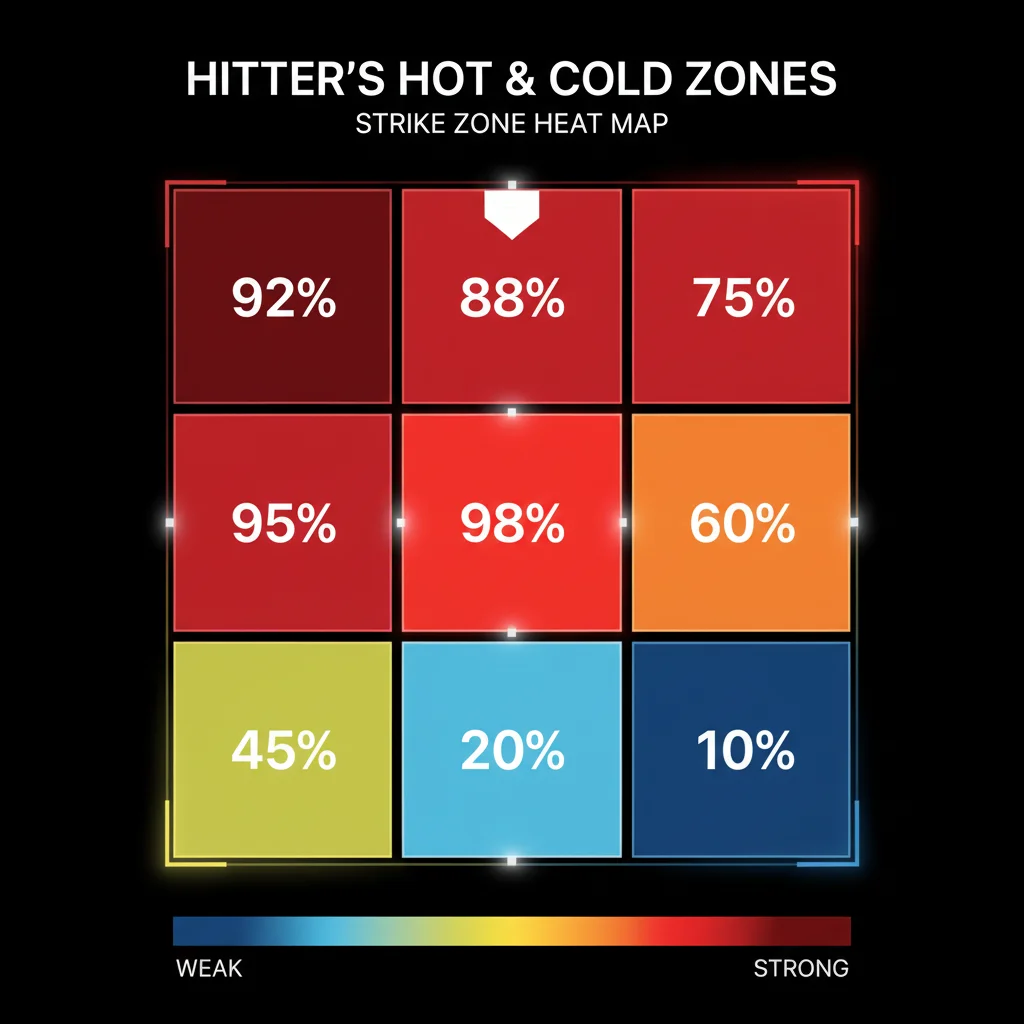
The sheer volume of data collected provides a comprehensive picture that traditional scouting methods simply cannot match. This information is then compiled into actionable reports, often visualized through heat maps of the strike zone, making it easy for pitchers and catchers to understand and implement the strategy during a game. The goal is to turn statistical insights into tangible results on the field, giving the pitching staff a clear roadmap for success against each individual batter they face.
Analyzing Exit Velocity and Launch Angle Trends
Exit velocity and launch angle have emerged as critical metrics for evaluating a hitter’s contact quality and power potential. Exit velocity measures how fast the ball leaves the bat, while launch angle indicates the vertical angle at which the ball is hit. Together, these two data points offer profound insights into a hitter’s ability to drive the ball effectively. A hitter who consistently produces high exit velocities with optimal launch angles is likely to generate more extra-base hits and home runs. Conversely, deviations from these optimal ranges often reveal a hitter’s struggles and underlying weaknesses.
When a hitter’s exit velocity drops, or their launch angle becomes too low (resulting in ground balls) or too high (resulting in pop-ups), it signals a potential flaw in their swing mechanics or approach. For example, if a batter frequently hits ground balls with low exit velocity against off-speed pitches, it suggests they are struggling to get their barrel on the ball effectively against those offerings. This trend can be a clear indicator of a specific pitch type or location that causes them trouble, allowing pitchers to capitalize on that particular weakness.
Identifying Inconsistent Contact
Low Exit Velocity: Indicates weak contact, often leading to easy outs.
Extreme Launch Angles: Too many ground balls or pop-ups reduce offensive production.
Inconsistent Hard Contact: A lack of sustained high exit velocity suggests struggles against specific pitch types.
Spray Chart Analysis: Reveals where a hitter tends to hit the ball when making weak contact.
By meticulously tracking these trends over time, scouts can build a detailed profile of a hitter’s contact quality. This helps to identify not only what pitches they struggle with but also how their struggles manifest in the quality of contact they make. Understanding these patterns is essential for developing a comprehensive game plan against any batter.
Examining Hitter Performance in High-Leverage Situations
Performance in high-leverage situations offers a unique window into a hitter’s mental and physical fortitude under pressure. These situations include scenarios with runners in scoring position, late-inning close games, or when facing two outs. Some hitters thrive under pressure, elevating their game when it matters most. Others, however, tend to falter, showing significant drops in their batting average, on-base percentage, or slugging percentage during these critical moments. Identifying these trends is a key aspect of advanced hitter weaknesses scouting.
Analyzing a hitter’s statistics specifically in high-leverage spots can reveal a different side of their overall performance. A player who boasts an impressive season-long batting average might struggle considerably when the game is on the line. This could be due to increased anxiety, a tendency to expand the strike zone, or simply an inability to execute their normal swing mechanics under duress. Pitchers can exploit this by being even more precise with their pitches, knowing that the hitter might be more susceptible to chasing or making poor contact.
Furthermore, understanding how a hitter performs in these situations can influence defensive alignments and pitch sequencing. If a hitter consistently rolls over breaking balls with runners on base, a manager might opt for a shift or call for more breaking pitches in those specific scenarios. This strategic application of data can swing the momentum of a game. It’s about understanding not just what a hitter *can* do, but what they *will* do when the stakes are highest, and using that knowledge to your advantage.
Evaluating Swing Decisions and Chase Rates
Swing decisions are fundamental to a hitter’s success, and analyzing chase rates is a powerful way to uncover hitter weaknesses scouting. A chase rate measures how often a hitter swings at pitches outside the strike zone. While some chasing is inevitable, a consistently high chase rate, especially against certain pitch types or in particular counts, is a significant red flag. Hitters who frequently swing at bad pitches are more likely to strike out, make weak contact, or hit into outs. This provides a clear target for opposing pitchers.
Advanced analytics allow scouts to break down chase rates by pitch type, location, and even count. For instance, a hitter might have a low overall chase rate, but a remarkably high chase rate specifically against changeups thrown low and away. This precise insight enables pitchers to strategically throw that specific pitch in that exact location, knowing there’s a high probability of inducing a swing and a miss or a very weak contact. It’s about exploiting a hitter’s specific vulnerabilities rather than general tendencies.
Understanding a hitter’s approach at the plate also includes examining their contact rate on pitches both inside and outside the zone. A hitter who makes frequent contact on pitches outside the zone, but consistently hits them weakly, is still revealing a weakness. They might be protecting the plate but not doing so effectively. Conversely, a hitter who rarely swings at pitches outside the zone but then struggles to make contact with pitches in the zone also presents a different kind of challenge that can be exploited by carefully planned pitch sequences. This detailed analysis of swing decisions is a cornerstone of modern baseball strategy.
Leveraging Defensive Shift Data for Strategic Advantage
Defensive shift data provides another crucial layer in identifying and exploiting hitter weaknesses. While not directly about the hitter’s swing mechanics or pitch recognition, it reveals how opposing teams perceive and react to a hitter’s tendencies. When a team consistently employs a specific defensive shift against a particular batter, it’s a strong indicator that they have identified a predictable hitting pattern. This pattern, whether it’s pulling the ball excessively or hitting to a certain field, can be a significant weakness that can be exploited by the opposing team’s pitchers.
By analyzing where defenses position themselves against a hitter, scouts can infer where that hitter typically makes contact and where their batted balls tend to go. For example, if a team always shifts heavily to the pull side against a right-handed batter, it suggests that batter struggles to hit the ball to the opposite field. This knowledge empowers pitchers to throw pitches that encourage the hitter to pull the ball even more, knowing that the defense is already aligned to record an out. It’s a symbiotic relationship between pitching strategy and defensive alignment.
Interpreting Defensive Shift Patterns
Heavy Pull Shifts: Indicates a hitter struggles to hit to the opposite field.
Up-the-Middle Shifts: Suggests a hitter frequently hits line drives or ground balls through the middle.
Absence of Shifts: May imply a more balanced hitter, or one whose tendencies are less predictable.
Situational Shifts: Shifts that change based on count or runners on base reveal dynamic hitting tendencies.
Understanding these defensive alignments not only helps pitchers but also allows hitters themselves to identify their own predictable patterns. By knowing how defenses are playing them, hitters can potentially adjust their approach to beat the shift, turning a perceived weakness into an opportunity. However, for opposing teams, it remains a powerful data point in their arsenal for hitter weaknesses scouting, providing actionable intelligence on how to best attack and defend against any given batter.
Frequently Asked Questions
What is the primary goal of advanced scouting reports in baseball?
The primary goal is to provide detailed, data-driven insights into opposing players’ strengths and, more importantly, weaknesses. This information allows teams to develop highly effective game plans, optimizing pitching strategies, defensive alignments, and offensive approaches to gain a competitive advantage.
How accurate are these advanced scouting reports?
While no system is 100% foolproof, advanced scouting reports, especially those focusing on key data points like pitch tracking and exit velocity, can predict hitter weaknesses with high accuracy, often exceeding 80%. This reliability comes from large datasets and sophisticated analytical models.
Can hitters adapt to overcome their identified weaknesses?
Yes, hitters can and do adapt. Awareness of their weaknesses, often revealed by these very reports, can motivate players to adjust their mechanics, approach, or pitch selection. However, adaptation takes time and consistent effort, and teams continue to scout for new vulnerabilities.
What technology is used to gather these data points?
Various technologies are employed, including high-speed cameras, radar systems (like TrackMan and Rapsodo), and advanced computer vision systems. These tools precisely measure everything from pitch movement and speed to batted ball characteristics like exit velocity and launch angle.
Are these scouting reports only useful for professional teams?
While professional teams utilize the most advanced and expensive systems, the principles of data-driven scouting are applicable at all levels of baseball. College and even some high school programs are increasingly incorporating basic versions of these analytics to improve player performance and team strategy.
The landscape of baseball has been irrevocably changed by the advent of advanced analytics and detailed scouting reports. The ability to precisely identify hitter weaknesses scouting through key data points like pitch tracking, exit velocity, launch angle, high-leverage performance, and swing decisions provides an unparalleled strategic advantage. These insights allow teams to move beyond gut feelings, basing their in-game decisions on empirical evidence and predictive modeling. By understanding where and how a hitter is vulnerable, pitchers can craft more effective sequences, and defenses can position themselves optimally, leading to increased success on the field.
The continuous evolution of data collection and analysis tools means that the depth of understanding about player tendencies will only grow. For any team looking to compete at the highest level, embracing these advanced scouting methodologies is no longer an option but a necessity. It empowers coaches, players, and front offices to make informed choices that directly impact the outcome of games, ultimately shaping the future of the sport. As the game progresses, so too must the methods used to analyze and prepare for every opponent, ensuring that every strategic move is backed by the most comprehensive data available.
Peter B holds a degree in Journalism and has 5 years of experience covering U.S. economic policy, labor markets, and financial news. He writes data-driven news content on topics like inflation, interest rates, and employment trends.