Beyond the Box Score: Advanced Basketball Statistics Explained
Unlock a new level of basketball understanding by exploring advanced statistics beyond traditional box scores. This guide introduces three crucial metrics: Player Efficiency Rating (PER), True Shooting Percentage (TS%), and Usage Rate (USG%), explaining how they offer deeper insights into player performance and team dynamics.
By: pedropadm2025@gmail.com on agosto 22, 2026
For many basketball fans, the traditional box score has long been the go-to for understanding a player’s performance. Points, rebounds, and assists tell part of the story, but to truly grasp a player’s impact and efficiency, diving into advanced basketball statistics is essential. These metrics offer a more nuanced perspective, revealing aspects of the game that might otherwise go unnoticed. They move beyond simple counting stats to assess a player’s contribution in a more comprehensive and context-aware manner, providing a richer understanding for both casual observers and dedicated analysts alike.
Understanding these deeper statistical layers can transform how you watch a game, evaluate trades, or even predict outcomes. It’s about seeing the hidden value, the subtle influences, and the true efficiency that traditional numbers often obscure. By exploring these advanced metrics, you can elevate your appreciation for the strategic depth of basketball and gain insights that even seasoned commentators sometimes miss. This deeper dive into analytics allows fans to appreciate the game on a whole new level, moving beyond the surface to the underlying mechanics of success.
Unpacking Player Efficiency Rating (PER)
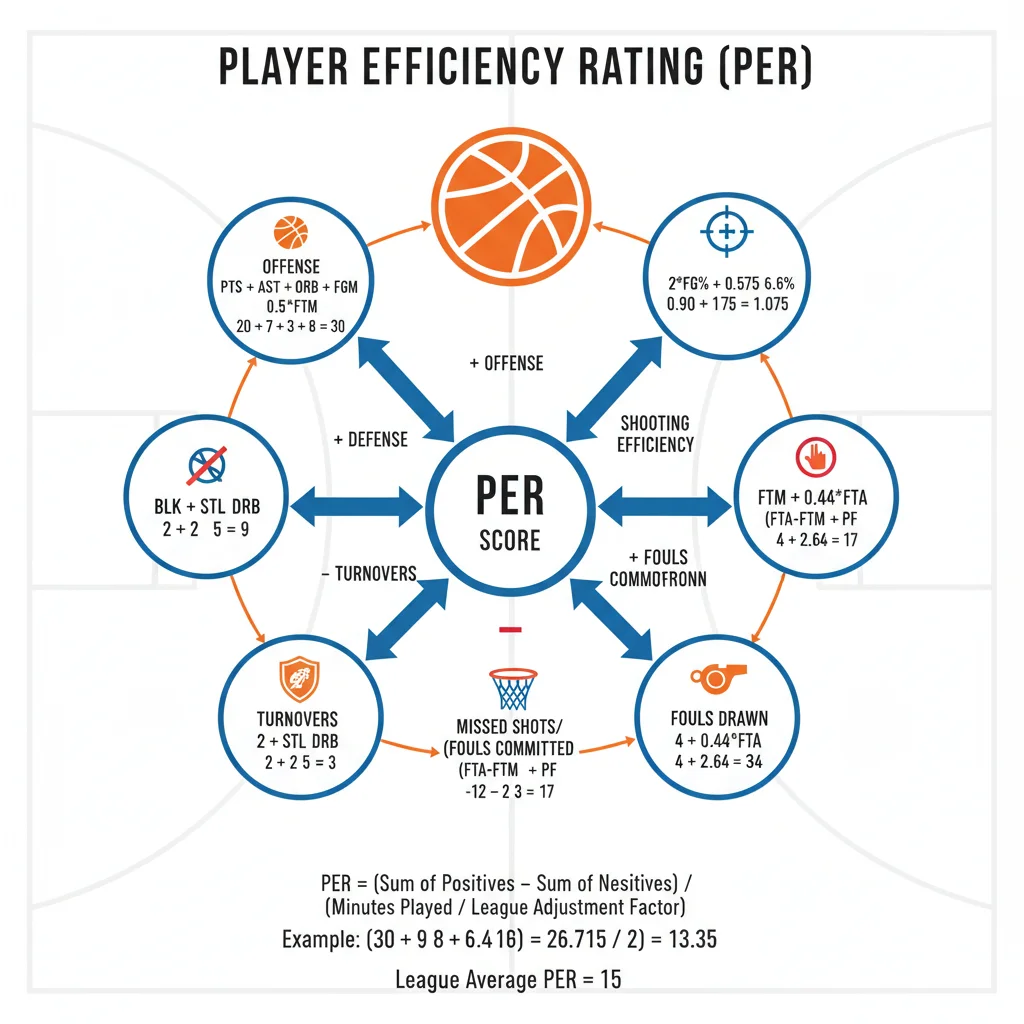
Player Efficiency Rating, or PER, is a per-minute rating developed by ESPN’s John Hollinger that attempts to boil down all of a player’s statistical accomplishments into a single number. It aims to measure a player’s per-minute production, adjusted for pace. Essentially, it adds up all positive accomplishments, like field goals, free throws, three-pointers, assists, blocks, and steals, and subtracts negative ones, such as turnovers and missed shots. The beauty of PER lies in its effort to provide a comprehensive view of a player’s overall contribution to a game, making it one of the most widely cited advanced basketball statistics.
A league-average PER is always 15.00, so any player above that mark is considered above average, and anything below is below average. Elite players often boast PERs well into the 20s or even 30s, indicating their exceptional all-around impact. However, it’s important to remember that PER heavily favors players who score and accumulate statistics, sometimes overlooking the contributions of defensive specialists who don’t fill up the stat sheet in traditional offensive categories. While a powerful tool, it doesn’t tell the entire story of a player’s value, particularly on the defensive end.
Despite its limitations, PER remains an invaluable metric for quickly assessing a player’s offensive productivity and overall statistical output. It provides a quick snapshot of how efficient a player is at generating positive statistical events during their time on the court. For fans looking to compare players across different teams or eras, PER offers a standardized benchmark. It helps identify players who are consistently productive and those who might be underperforming relative to their playing time, making it a cornerstone for initial player evaluation.
Understanding True Shooting Percentage (TS%)
True Shooting Percentage, or TS%, is a more accurate measure of shooting efficiency than traditional field goal percentage. Unlike field goal percentage, which only accounts for successful shots from the field, TS% factors in free throws and three-pointers, giving a more complete picture of how efficiently a player scores points. This metric recognizes that not all shots are created equal; a three-pointer is worth more than a two-pointer, and free throws, while not field goals, are still points scored that contribute to a player’s offensive output. It’s a crucial tool for evaluating offensive efficiency.
The formula for TS% is points divided by two times the sum of field goal attempts plus 0.44 times free throw attempts. The 0.44 constant is an approximation to account for the fact that a player typically gets two free throws for a shooting foul, but not every foul results in two free throws (e.g., and-ones, technical fouls). This adjustment ensures that free throws are appropriately weighted in the overall efficiency calculation. A higher TS% indicates that a player is scoring more points per shot attempt, making them a more efficient offensive weapon for their team.
Why is TS% so important? Consider a player who shoots 45% from the field but rarely takes three-pointers and is a poor free-throw shooter. Their field goal percentage might look decent, but their TS% could reveal they are not as efficient as a player who shoots 40% from the field but takes many threes and converts free throws at a high rate. TS% helps identify genuinely efficient scorers, rewarding players who maximize their scoring opportunities across all shot types. It provides a clearer lens through which to view offensive impact, moving beyond the superficiality of traditional shooting percentages.
Delving into Usage Rate (USG%)
Usage Rate, or USG%, estimates the percentage of team possessions a player uses while on the floor. This includes possessions ending in a field goal attempt, a free throw attempt, or a turnover. Essentially, it tells you how often a player is involved in their team’s offensive plays when they are in the game. A high USG% indicates that a player is a primary offensive option, taking a large number of shots or generating many possessions through their playmaking. Conversely, a low USG% suggests a player is more of a role player, often looking for opportunities created by others.
It’s important to differentiate between high usage and efficient usage. A player can have a very high USG% but be inefficient, meaning they use a lot of possessions but don’t convert them into points effectively, or they turn the ball over frequently. On the other hand, a player with a high USG% and high efficiency (as measured by metrics like TS% or PER) is often an elite offensive talent, capable of carrying a significant portion of their team’s scoring load. This metric helps coaches understand who is driving the offense and how much offensive responsibility a player is shouldering.
USG% is particularly useful when evaluating players who are expected to be primary offensive creators. For instance, if a star player has a relatively low USG% but their team struggles offensively, it might suggest they aren’t being utilized enough. Conversely, if a player has an extremely high USG% but their team’s offense isn’t thriving, it could indicate that they are taking too many difficult shots or are not creating enough for their teammates. This advanced basketball statistic provides context for a player’s role within their team’s offensive scheme and helps assess their primary contributions.
Advanced Rebounding: Rebounding Percentage
Beyond simply counting rebounds, Rebounding Percentage (REB%) offers a more insightful look into a player’s ability to secure missed shots. This advanced basketball statistic calculates the estimated percentage of available rebounds a player grabs while they are on the floor. It breaks down into Offensive Rebounding Percentage (OREB%) and Defensive Rebounding Percentage (DREB%), allowing for a specific assessment of a player’s impact on either end of the court. Unlike raw rebound totals, which can be inflated by playing many minutes or being on a team that misses a lot of shots, REB% normalizes these factors, providing a truer measure of rebounding prowess.
A high OREB% indicates a player is skilled at battling for offensive boards, creating second-chance opportunities for their team. These extra possessions are incredibly valuable, often leading to easy put-back scores or forcing defensive breakdowns. Conversely, a strong DREB% signifies a player’s ability to secure defensive rebounds, ending opponent possessions and initiating fast breaks. Players with consistently high rebounding percentages, particularly on the defensive glass, are crucial for controlling the pace of the game and limiting opponents’ scoring chances. This metric moves beyond the simple act of grabbing a ball.
Why Rebounding Percentage Matters
Contextualizes Rebounding: It accounts for the actual opportunities a player has to grab a rebound, rather than just the total number.
Identifies Specialists: Helps pinpoint players who are elite offensive or defensive rebounders, regardless of their overall minute count.
Impact on Possessions: Directly reflects a player’s ability to create extra possessions (offensive) or deny them (defensive).
Team Strategy: Coaches use these percentages to understand which players are most effective in specific rebounding roles within their system.
Understanding Rebounding Percentage allows fans to appreciate the often-unsung heroes who consistently win battles on the boards. It highlights the players who, through positioning, effort, and timing, give their team crucial advantages in the possession game. This statistic helps to move beyond the raw numbers and truly evaluate a player’s effectiveness in a critical aspect of basketball, showing who truly impacts the flow of the game by controlling the glass.
Evaluating Playmaking with Assist-to-Turnover Ratio
While not strictly an advanced basketball statistic in the same vein as PER or TS%, the Assist-to-Turnover Ratio (AST/TO) is a vital metric for evaluating a player’s efficiency as a playmaker and ball-handler. It simply divides a player’s total assists by their total turnovers. A higher ratio indicates that a player is effectively creating scoring opportunities for teammates without sacrificing possessions through careless mistakes. This ratio is particularly crucial for point guards and primary ball-handlers, as their role directly involves facilitating offense and minimizing turnovers.
Players with a high AST/TO ratio demonstrate strong decision-making, good court vision, and excellent ball control. They are reliable facilitators who can orchestrate an offense while keeping turnovers to a minimum. Conversely, a low AST/TO ratio suggests a player might be prone to risky passes, struggle under pressure, or simply not be as effective at creating for others without also giving the ball away. This metric provides a clear, quantitative measure of a player’s ability to balance playmaking with ball security, a fundamental aspect of efficient offense.
The significance of AST/TO extends beyond individual player evaluation; it also offers insights into team offensive flow. Teams with multiple players possessing strong assist-to-turnover ratios often run more fluid and mistake-free offenses. This metric helps identify players who can consistently make the right pass and avoid costly errors, which are critical traits for maintaining offensive rhythm and preventing easy transition points for opponents. It’s a foundational statistic that underpins much of what makes an offense hum, reflecting a player’s ability to make smart, impactful decisions with the ball in their hands.
Frequently Asked Questions
What is the main benefit of using advanced basketball statistics?
The main benefit is gaining a deeper, more nuanced understanding of player performance and team dynamics beyond what traditional box scores offer. These statistics provide context, measure efficiency, and highlight contributions that might otherwise go unnoticed, leading to more informed analysis.
Are advanced statistics only for professional analysts?
Not at all! While professional analysts use them extensively, advanced statistics are increasingly accessible and understandable for any basketball fan. Learning these metrics can significantly enhance your enjoyment and comprehension of the game.
Do advanced statistics replace traditional stats entirely?
No, advanced statistics don’t replace traditional stats but rather complement them. Traditional stats like points, rebounds, and assists provide the foundational context, while advanced metrics then offer a more detailed and efficient evaluation of those actions.
Can advanced stats predict future player performance?
While no statistic can guarantee future outcomes, advanced stats can provide strong indicators of a player’s potential and likely performance trajectory. They help identify sustainable strengths and areas for improvement, making predictions more informed.
Where can I find these advanced basketball statistics?
Many sports websites and dedicated basketball analytics platforms offer these statistics. Reputable sources like Basketball-Reference.com, NBA.com/stats, and ESPN provide comprehensive databases for both current and historical advanced metrics.
Moving beyond the traditional box score to embrace advanced basketball statistics truly unlocks a new dimension in appreciating the game. Metrics like Player Efficiency Rating (PER) offer a comprehensive view of per-minute production, while True Shooting Percentage (TS%) provides a more accurate measure of scoring efficiency across all shot types. Usage Rate (USG%) illuminates a player’s offensive involvement, and Rebounding Percentage (REB%) gives context to their board-crashing abilities. Finally, the Assist-to-Turnover Ratio (AST/TO) reveals the delicate balance between playmaking and ball security, crucial for any effective offense.
These advanced metrics aren’t just for statisticians or general managers; they are powerful tools for every fan looking to deepen their understanding of basketball. By integrating these insights into your viewing experience, you’ll start to see the game with a more analytical eye, appreciating the subtle impacts and efficiencies that determine success on the court. Whether you’re evaluating a player’s true worth, dissecting team strategies, or simply enjoying the nuances of a well-played game, advanced statistics provide the language to articulate what makes a player or a team truly great. So, next time you watch a game, try looking beyond the familiar numbers and let these advanced metrics guide your analysis.
Peter B holds a degree in Journalism and has 5 years of experience covering U.S. economic policy, labor markets, and financial news. He writes data-driven news content on topics like inflation, interest rates, and employment trends.